|
|
Visitor Dashboard
Visitor Dashboard provides information about visits such as number of visits, their purpose, source, and status. It also shows visitor information such as new vs. frequent visitors, visitor trends, and watchlist.
By default, the dashboards present data for the current date, but you can change the date by clicking on the Calendar icon at the top of the page.
Screen Layout of Visitor Dashboard

Field Description of Visitor Dashboard
The various dashboards are described below:
Overview
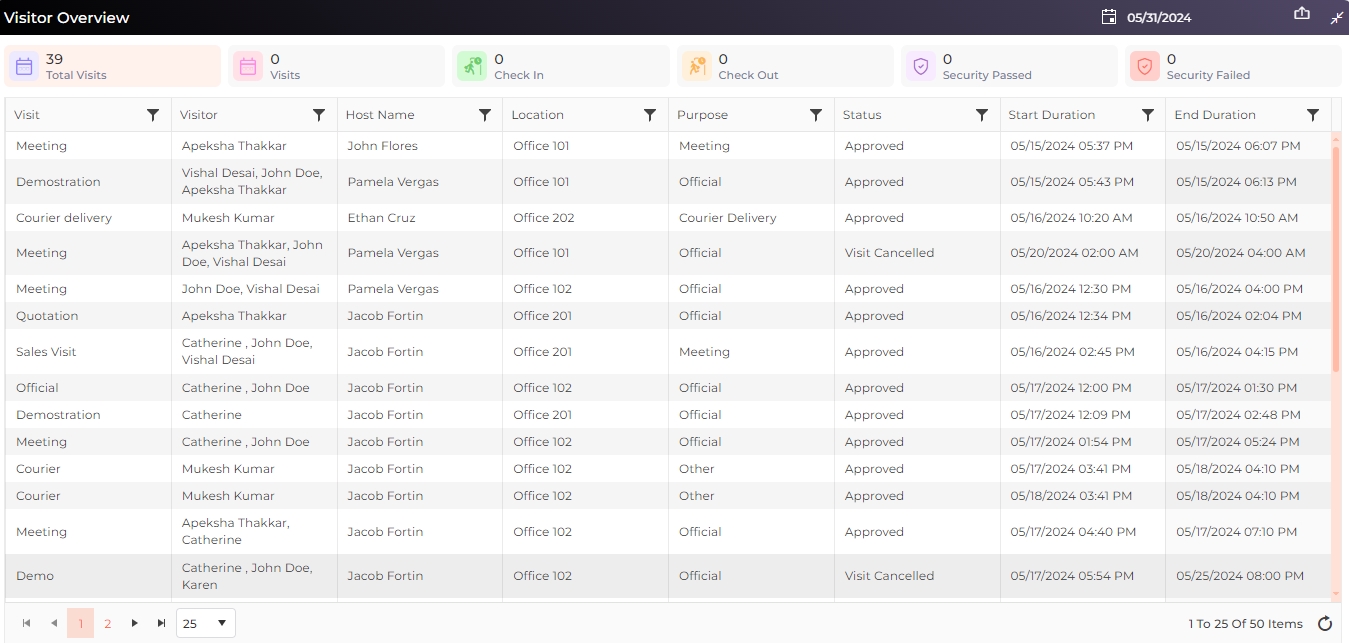
It shows the overall visitor summary: Total Visits , Check In, Check Out, Security Passed, and Security Failed for the selected date in the calendar.

It will even show a detailed view for each parameter when clicked on. A count of Total Visitors is also displayed which is regardless of location and date.
Visit by Purpose
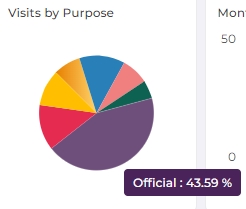
This dashboard shows the percentage of visits for each purpose in the form of a pie chart. Hover the mouse over the chart to know the percentage of each purpose of visit.
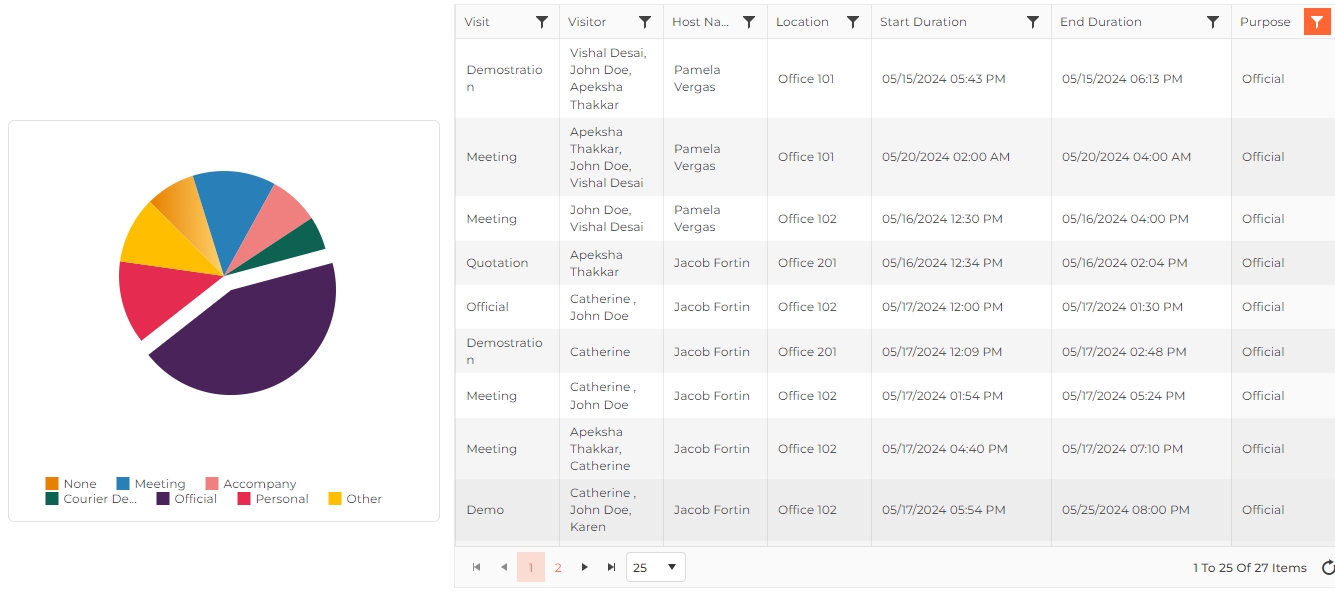
Furthermore, click on the pie chart to view the visit details belonging to the selected Purpose as shown below:
Monthly Visits
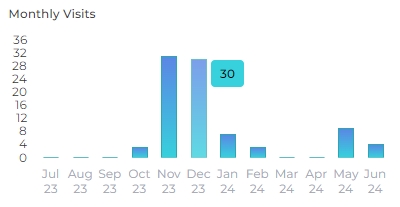
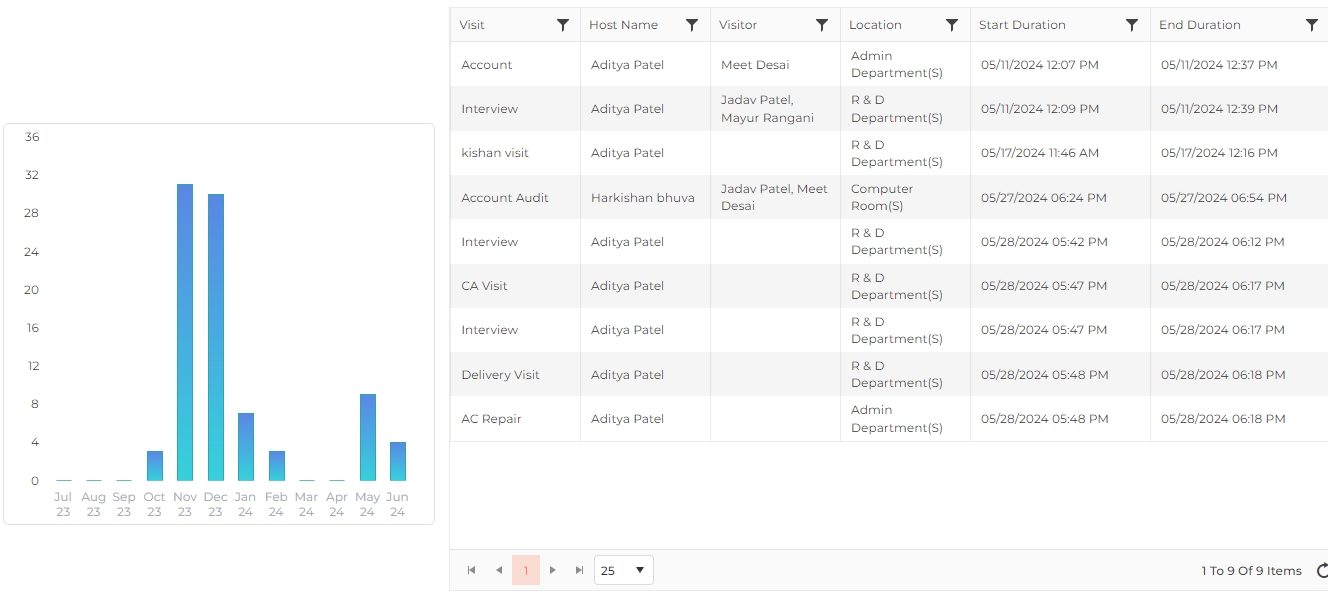
It shows the number of visits per month for the last 12 months. Hover the mouse over the chart to know the number of visits for a particular month.
Click on a particular bar chart to view visit details for that month as follows:
New vs Frequent Visitors
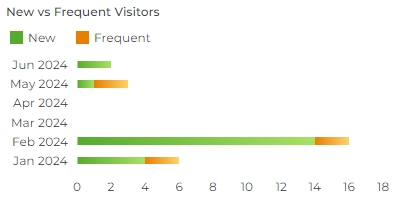
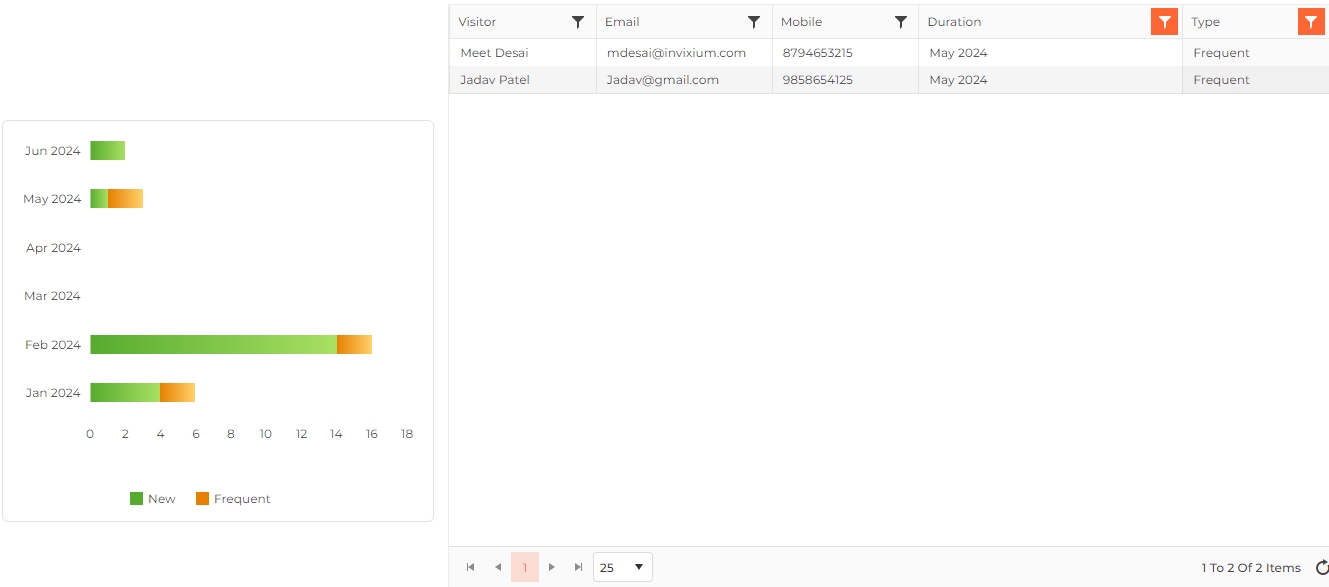
This chart shows the comparison between new and returning visitors on a monthly basis over the past six months, starting from the selected date. New visitors are those who have visited just once within a month, while frequent visitors are those who have visited more than once within the same month.
Clicking on the chart will provide visitor details of that particular type for the month as shown under:
Watchlist
It shows the number of visitors and companies in the Watchlist as follows:
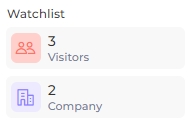
Clicking on the number will provide details of that particular category as shown under:

Source of Visits
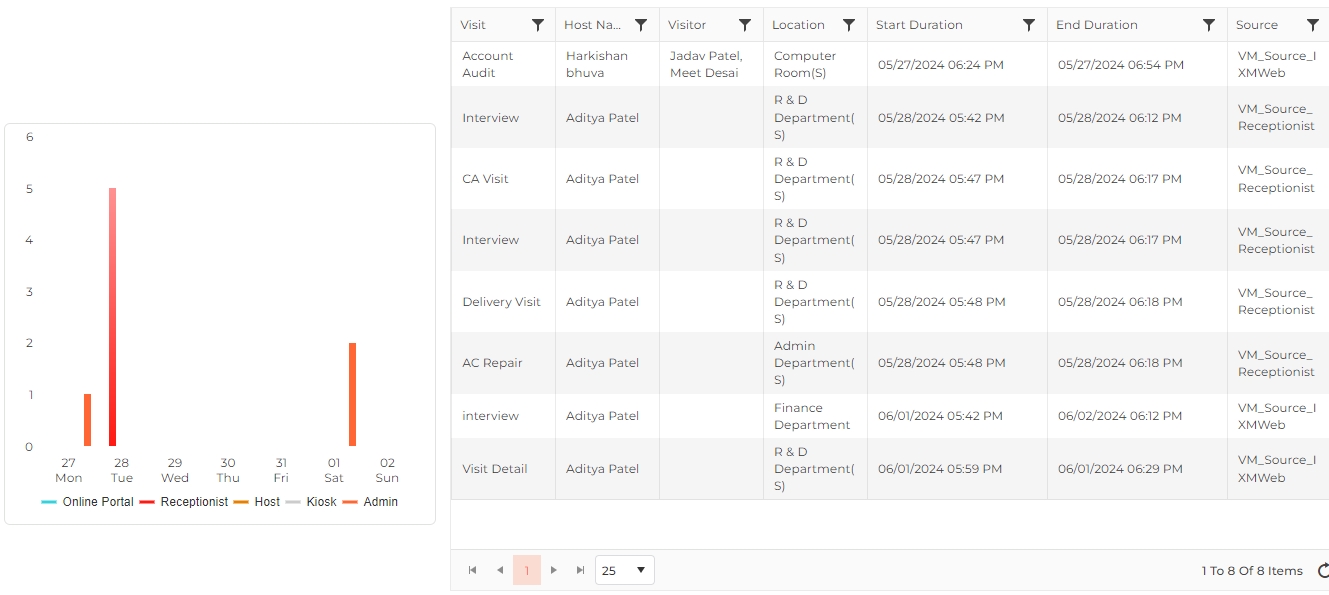
It shows the number of visits created by the administrator, receptionist, or host in the form of a bar chart in a week or in a month. Hover the mouse over the bar chart to know share of each source.

Furthermore, click on the bar chart to view the details of visits created by the selected source as shown below:
Planned vs Actual Visits
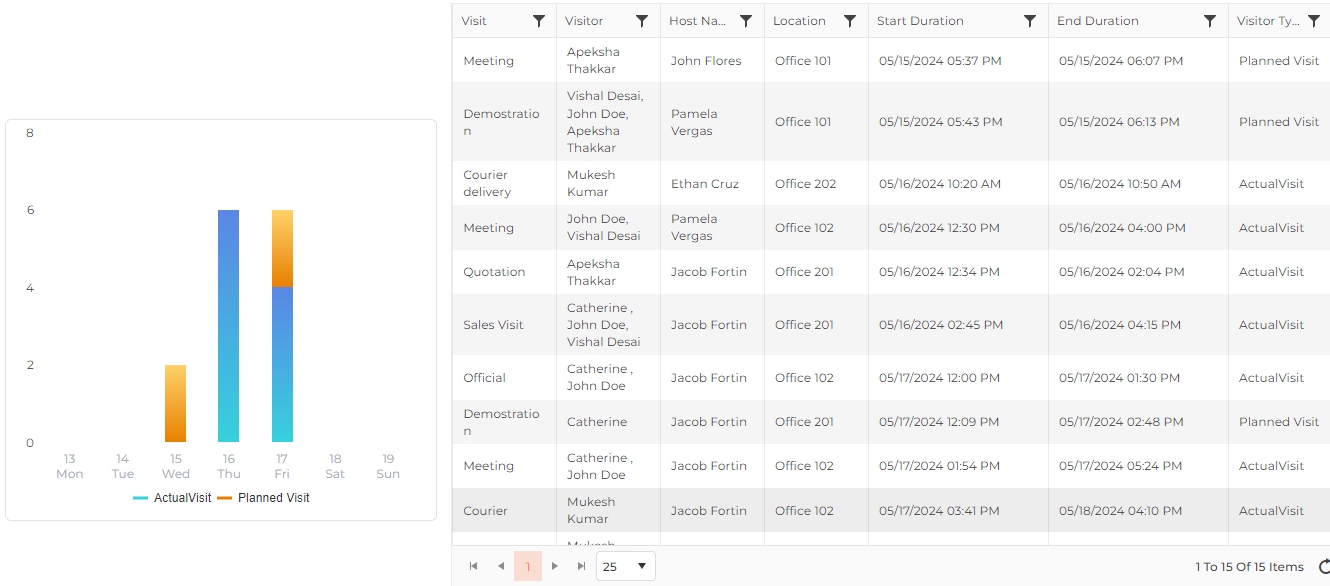
The bar chart shows the comparison between planned and actual visits for each day of the week or month. Actual visits are those that were created for the current date and time whereas planned visits are those that were scheduled for the later date or time.

Furthermore, click on the bar chart to view the visit details as shown below:
Visitor Trends
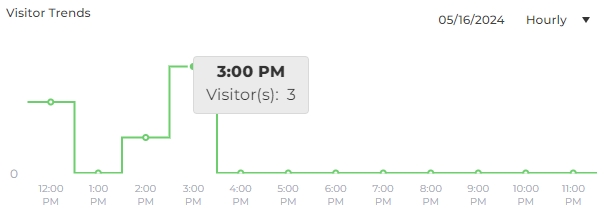
This chart shows the number of visitors who have checked-in on an hourly, weekly, and monthly basis. Hover the mouse over the chart to know the number of visitors who checked-in during each hour, or day.
Visit Status
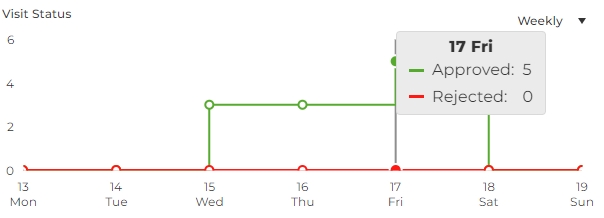
Using this chart, know the status of each visit during a week, month, or year. Hover the mouse over the chart to know the number of approved and rejected visits for that day or month.
Evacuation
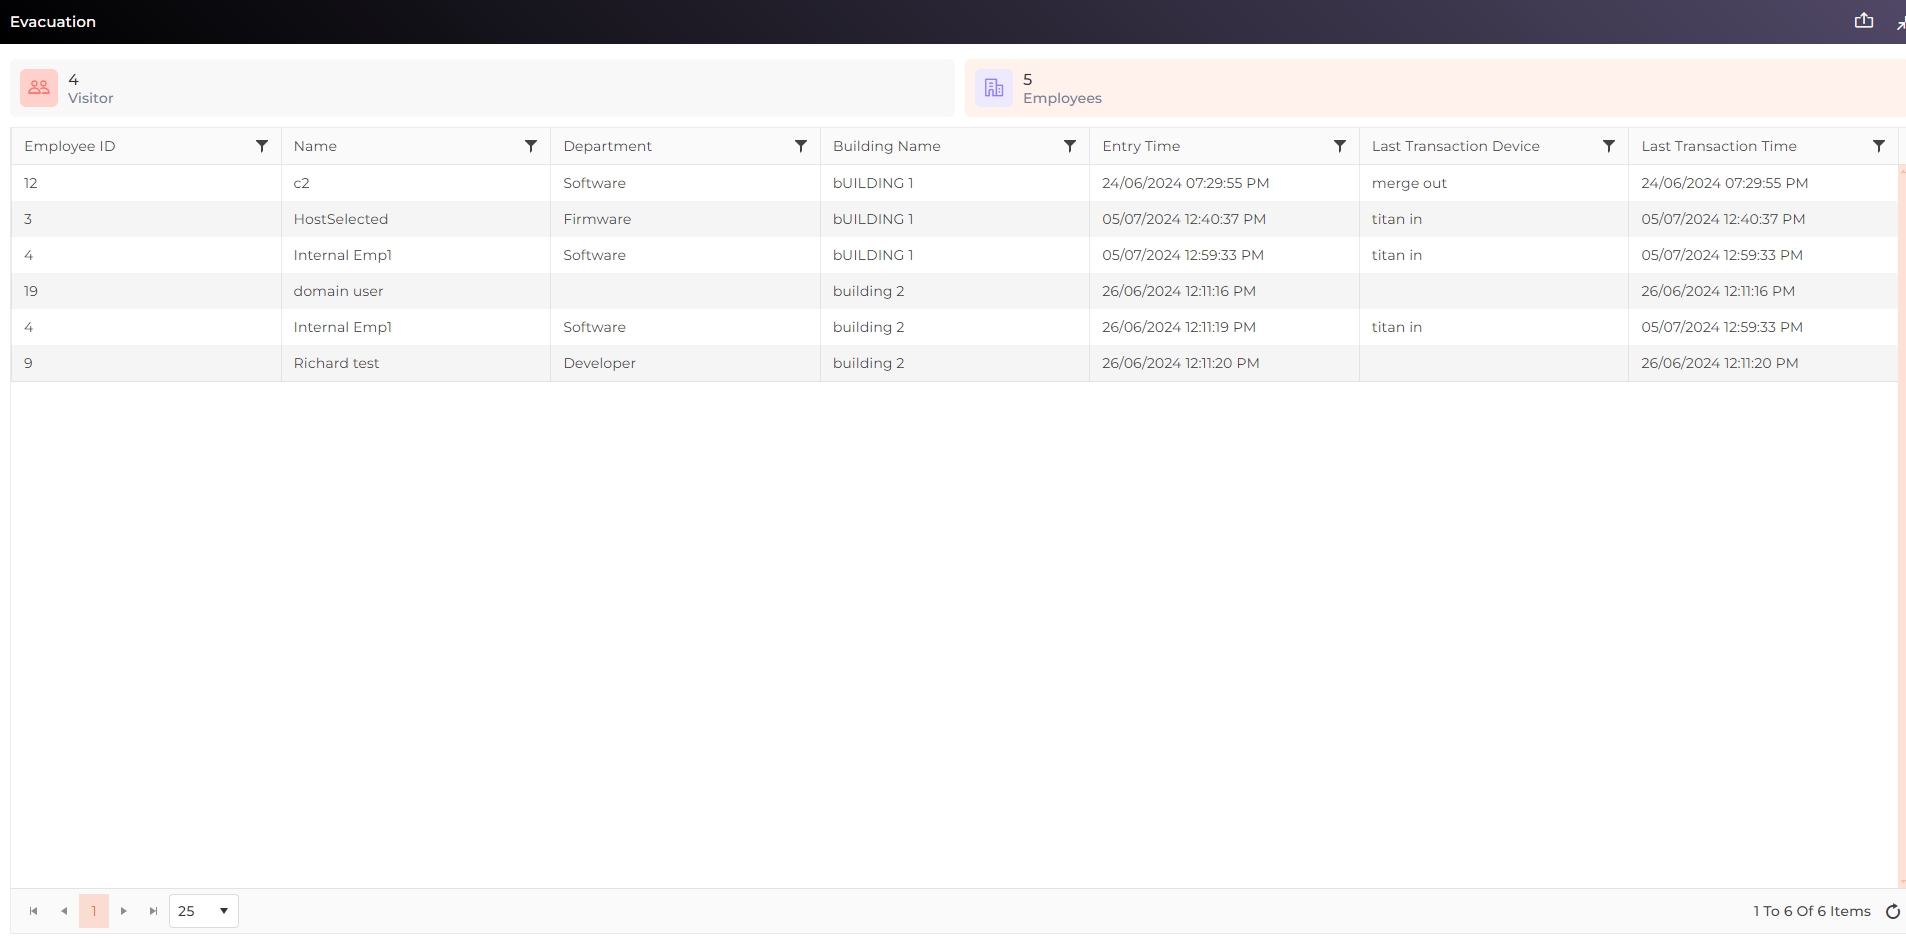
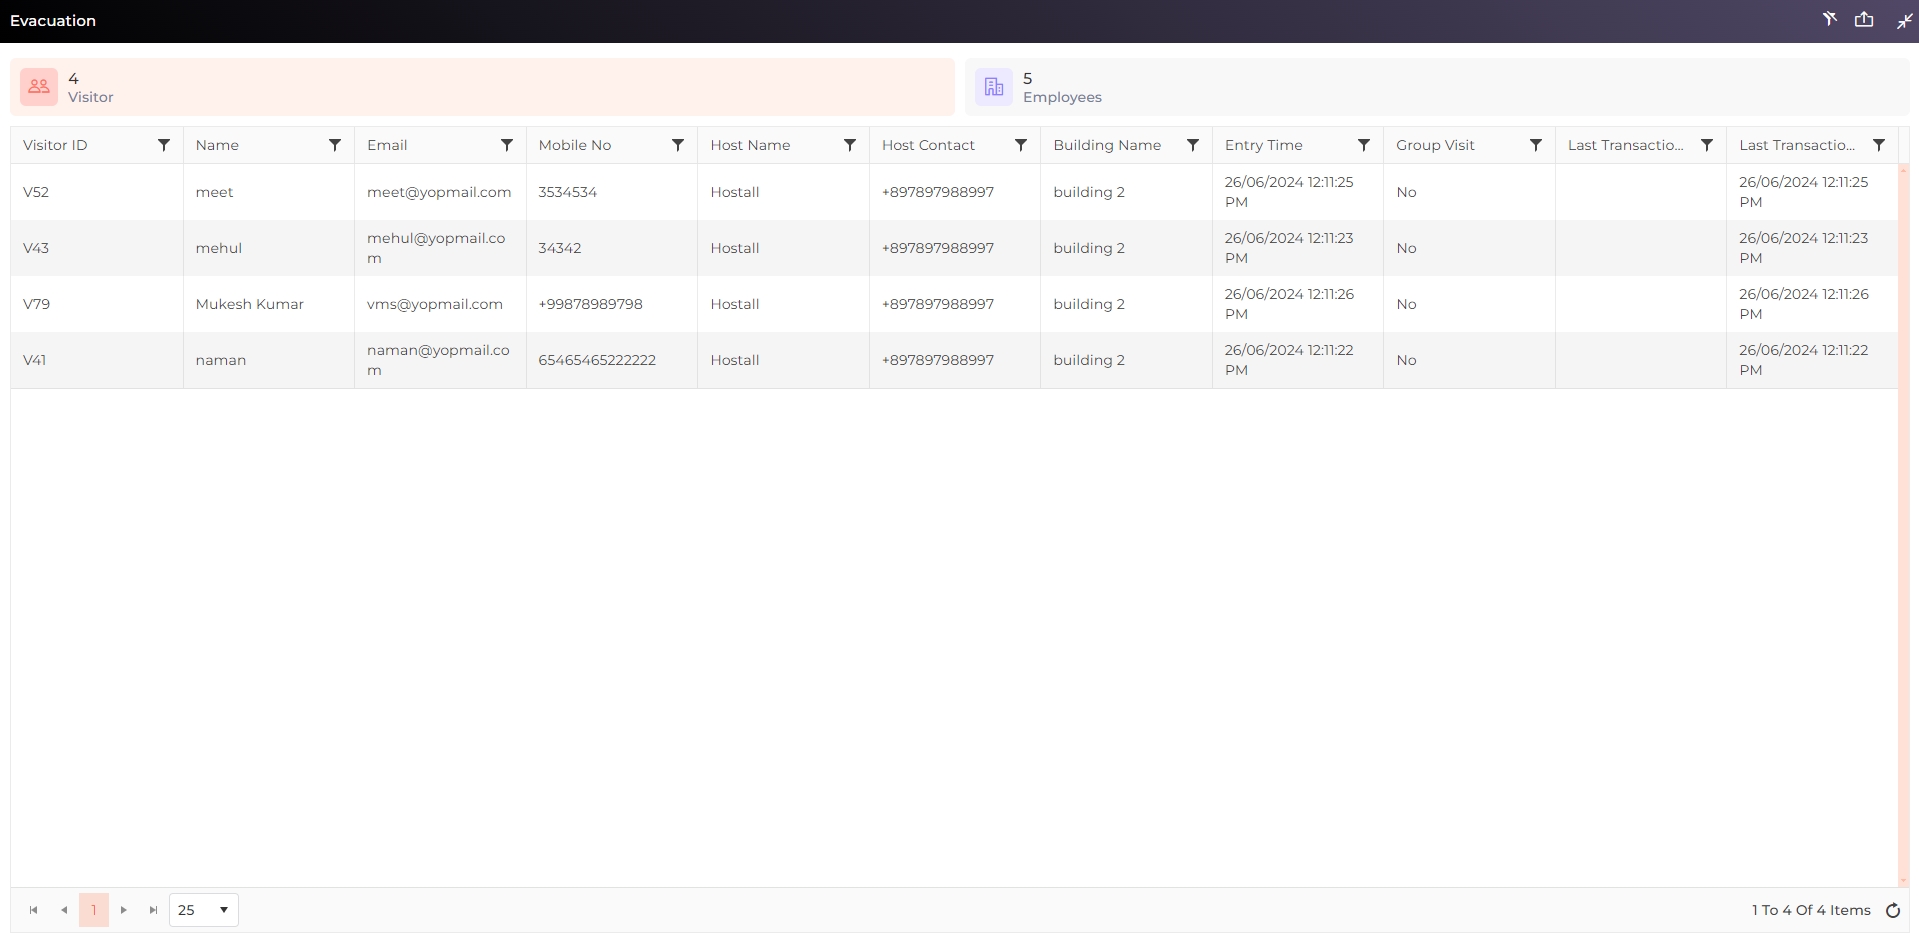
This chart displays the current number of visitors (including both outside visitors and employees) who have checked into the locations but have not checked out yet. It is useful in emergencies such as fires, when it is crucial to know the number of people present within the premises. The count resets to 0 at the beginning of each day. The chart provides separate counts for visitors and employees. The Visitor count indicates the number of outside visitors present in the location, and the Employee count shows the number of employees who are visiting the location along with the local employees who have entered the location after authentication through a device.

Furthermore, click on "Visitor" or "Employees" on the chart to view the visitor details as shown below:
Visitor Evacuation:
Employee Evacuation:
